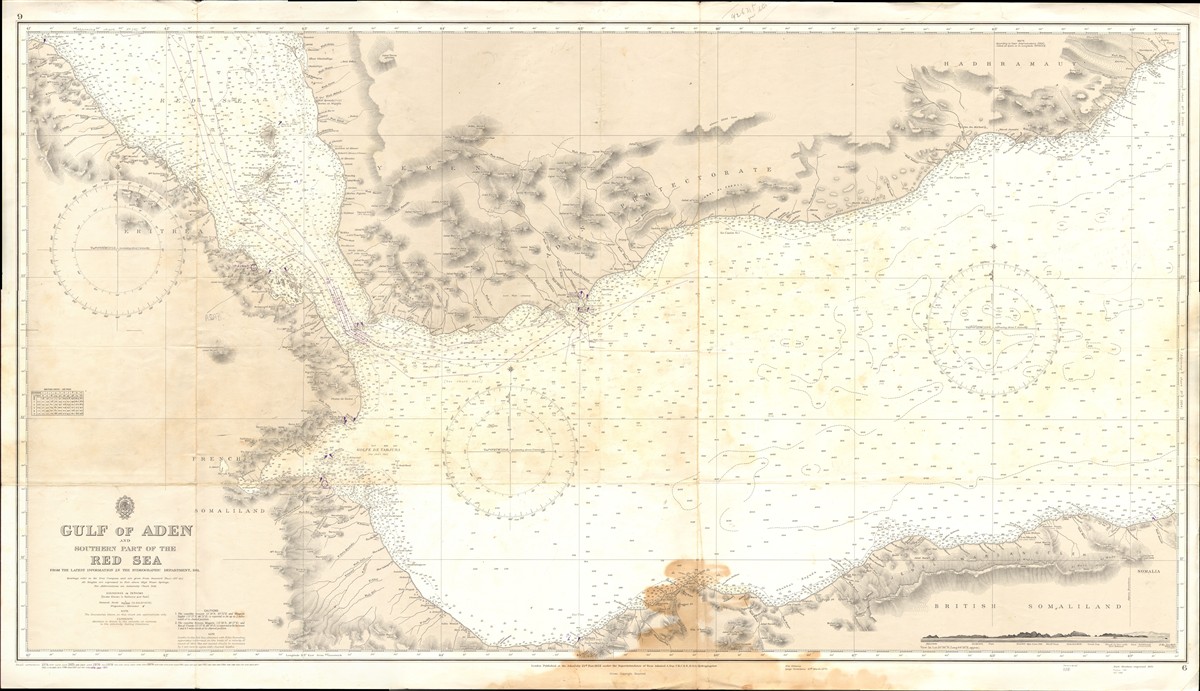
Where is the Gulf of Aden on a map and what does it connect?
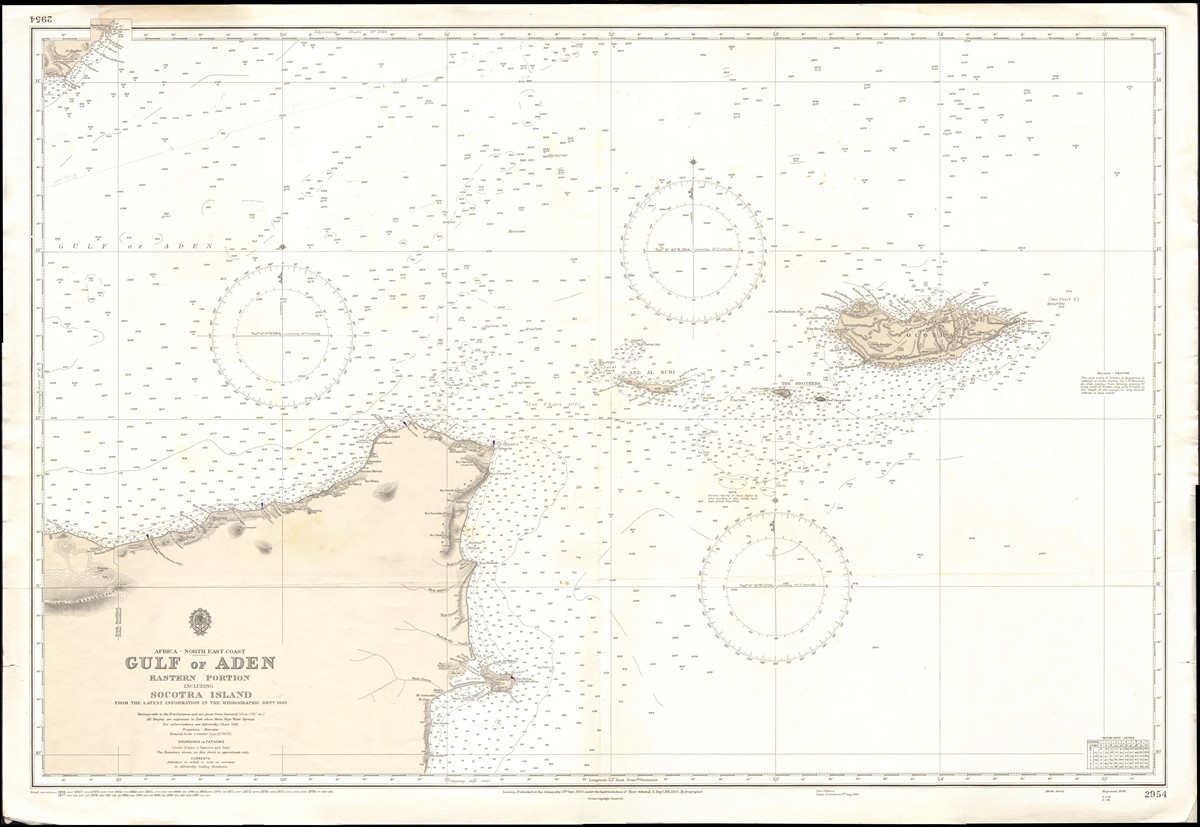
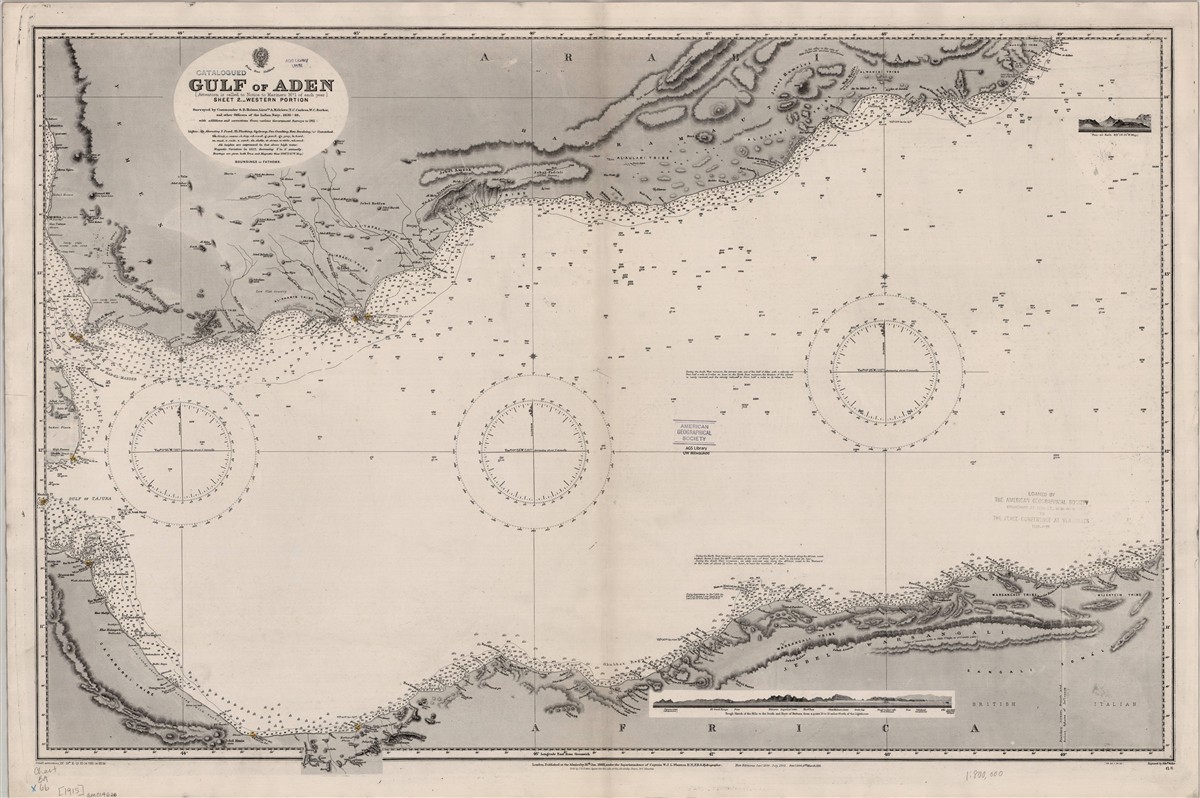
The Gulf of Aden lies between Yemen on the Arabian Peninsula and Somalia in the Horn of Africa, forming the eastern approach to Bab el-Mandeb and the Red Sea corridor. On a map, this position makes it a gateway between dense Europe-bound routes and open-ocean alternatives. Geography alone explains why disruptions in this zone can influence vessel planning far beyond the immediate area. It is not only a regional waterway; it is a timing and cost junction for globally distributed cargo systems.
Unlike broader ocean lanes where ships can disperse and absorb risk, this corridor concentrates decision pressure. Operators must choose between waiting, convoying, route modification, or full rerouting with limited time and incomplete information. That pressure is magnified when incidents coincide with existing schedule tightness in container and tanker markets. The result is a corridor where confidence can degrade faster than physical throughput statistics suggest.
For cross-corridor context, readers should compare this page with Suez canal map and Strait of Hormuz on a map. Together these routes define much of the current risk conversation in intercontinental maritime planning.
How Bab el-Mandeb and the Gulf of Aden map work as one risk system
Analytically, Bab el-Mandeb and the Gulf of Aden should be treated as a coupled system. A disruption signal in one segment often affects behavior in the other because operators model the full transit chain, not isolated map boxes. If confidence falls near Bab el-Mandeb, insurers and charter desks re-evaluate exposure throughout adjacent waters. If confidence falls in the Gulf of Aden, northbound routing into the Red Sea can decline even without formal closure.
This coupling effect is why incident location matters as much as incident type. Events near high-traffic waypoints can trigger wider caution than events in peripheral zones. Map-aware analysis therefore prioritizes route proximity, repeat frequency, and response effectiveness over headline intensity alone. A low-casualty event in a critical lane may alter decisions more than a dramatic event farther from core traffic patterns.
The practical implication is that risk teams need shared visualization across marine operations, finance, and executive leadership. Without a common map language, organizations overreact to narratives or underreact to structural signal shifts. A clear corridor model improves both speed and consistency.
| Segment | Primary function | Risk transmission mechanism |
|---|---|---|
| Bab el-Mandeb approach | Gateway control between Red Sea and Gulf of Aden. | Security confidence shifts convoy and timing decisions. |
| Central Gulf of Aden lanes | Transit corridor for mixed vessel classes. | Incident clustering changes insurer and charter behavior. |
| Open-ocean transition zone | Decision point for reroute continuation. | Cost-confidence tradeoff determines route commitment. |
Incident patterns: piracy legacy, strike risk, and reporting noise
Historically, Gulf of Aden coverage was dominated by piracy risk. In recent cycles, the threat picture has become more layered, including kinetic incidents linked to regional conflict dynamics and broader signaling campaigns. This does not eliminate piracy relevance, but it changes the decision framework. Operators now evaluate multiple threat vectors simultaneously: opportunistic boarding risk, projectile or drone threats, and information volatility during unfolding events.
Reporting quality is a recurring challenge. Initial accounts are often fragmented, especially during periods of high operational tempo. Public feeds can mix confirmed incidents with unverified claims, which distorts perception and pricing. Teams should therefore separate "reported events" from "validated events" in their dashboards. This simple taxonomy reduces reaction errors and helps leadership understand confidence bands around risk estimates.
Cross-referencing with US-Iran conflict timeline can also help analysts distinguish local maritime patterns from broader geopolitical escalation cycles.
Insurance and freight dynamics visible in a Gulf of Aden map workflow
Insurance markets are often the fastest channel through which corridor stress becomes measurable. War-risk and additional premium guidance can shift within hours, especially when incident attribution remains uncertain. Freight rates then adjust based on expected delay, rerouting probability, and vessel availability. In this sequence, market behavior may appear to "overreact," but it often reflects rational pricing of uncertainty rather than panic.
A map-centric workflow improves interpretation by tying price changes to route-specific exposure. If premiums rise but traffic remains concentrated in high-risk segments, the signal suggests confidence is deteriorating slower than cost. If premiums rise and rerouting accelerates, confidence has likely broken below operational thresholds. These distinctions matter for procurement, inventory planning, and contractual negotiation strategy.
For energy-sensitive readers, the interaction between Gulf of Aden routing and broader commodity corridors is covered in Iran oil and Hormuz risk. The key lesson is that costs can rise materially before supply loss is visible in aggregate export figures.
| Indicator | Early interpretation | Decision implication |
|---|---|---|
| War-risk premium widening | Insurer confidence is weakening. | Reassess route economics and contractual exposure. |
| Spot freight rate spikes | Capacity is repricing uncertainty. | Secure critical cargo slots or hedge timing risk. |
| Reroute share increase | Operators expect prolonged instability. | Update delivery windows and network planning assumptions. |
| Stable premiums with incidents | Market sees events as contained. | Maintain monitoring; avoid premature overreaction. |
Humanitarian and commercial tradeoffs in Gulf of Aden security cycles
Security stress in the corridor has commercial consequences, but it also affects humanitarian logistics tied to fragile coastal regions. Aid shipments, food imports, and medical supply routes can become more expensive or less predictable when insurers and operators tighten risk terms. For policymakers, this creates a dual challenge: preserving commercial flow while preventing secondary humanitarian deterioration.
From a map perspective, the challenge is one of route overlap. Humanitarian cargo often depends on the same maritime arteries as commercial freight, even if volumes are smaller. When shipping confidence drops, both systems are affected, but humanitarian actors usually have fewer financial hedging tools. Analysts should include this asymmetry in briefings to avoid narrow market-only narratives.
This lens also helps decision-makers avoid false binaries. Corridor security policy is not only about "keeping trade open"; it is also about maintaining access conditions for vulnerable populations in coastal conflict zones.
Scenario playbook for shipping teams and risk committees
A practical Gulf of Aden playbook should define action by confidence-weighted scenarios: contained incidents, recurring incidents, and sustained high-friction environment. In contained scenarios, teams increase monitoring cadence and tighten communications without major route changes. In recurring scenarios, they segment cargo by urgency, adjust insurance strategy, and prepare selective rerouting. In sustained high-friction scenarios, they rebalance network design and contractual priorities around longer transit assumptions.
Process discipline matters more than prediction precision. Many costly errors occur when teams repeatedly switch strategy based on noisy updates. A threshold-based playbook reduces this whipsaw effect by requiring defined trigger conditions before changing route posture. It also improves stakeholder communication because customers and executives can see why decisions change, not just that they changed.
| Scenario | Trigger set | Recommended response |
|---|---|---|
| Contained incidents | Low incident frequency, stable insurer stance. | Enhanced monitoring and advisory-based routing updates. |
| Recurring incidents | Repeated events and widening premium spreads. | Cargo segmentation, selective reroutes, and contract review. |
| Sustained high friction | Persistent uncertainty and broad reroute adoption. | Network redesign, longer lead-time planning, executive governance. |
Weekly monitoring signals that outperform headline tracking
High-value monitoring starts with signal hierarchy. First-tier signals include incident validation rate, insurer circular changes, and route adoption shifts. Second-tier signals include port delay data and official rhetoric trend. Third-tier signals include social-media chatter and single-source rumors. Teams that rank inputs this way spend less time chasing noise and more time updating decisions that affect cost and schedule outcomes.
Another useful practice is maintaining a weekly variance log. Record what actually happened versus what your scenario model expected. Over several cycles, this reveals whether your thresholds are too sensitive or too slow. It also supports post-event audits and improves board-level confidence in the risk process.
To keep this monitoring connected to broader regional patterns, link with Persian Gulf map, US base map, and Iran protests for domestic-stability spillover signals.
Decision architecture: aligning carriers, charterers, and risk committees
Different stakeholders in the same voyage often optimize for different outcomes. Carriers may prioritize network reliability and customer commitments, charterers may prioritize delivered-cost control, and risk committees may prioritize downside containment. During Gulf of Aden stress, these priorities can diverge sharply unless governance is explicit. A strong decision architecture pre-defines who can trigger route changes, who approves insurance adjustments, and who owns external communication. Without this structure, teams lose time in internal debate while market conditions keep moving.
One effective approach is a two-track model. Track one handles immediate voyage-level decisions with tightly scoped authority and clear thresholds. Track two handles portfolio-level adjustments such as contract renegotiation, inventory rebalancing, and quarterly risk-budget changes. The two tracks should exchange data at fixed intervals, but not block each other. This prevents local urgency from overwhelming strategic planning and avoids strategic overreach by teams closest to day-to-day operations.
Escalation criteria should combine hard and soft signals. Hard signals include validated incidents, premium changes, and route closure notices. Soft signals include confidence deterioration in official language and persistent uncertainty in incident attribution. Decisions based solely on hard signals can be too slow; decisions based solely on soft signals can be too expensive. Blended criteria create better timing discipline.
| Stakeholder | Primary objective | Best decision cadence |
|---|---|---|
| Marine operations | Safe, efficient voyage execution. | High-frequency updates with threshold triggers. |
| Commercial/chartering | Margin protection and contract continuity. | Daily reassessment during elevated risk periods. |
| Risk and compliance | Downside control and policy adherence. | Scenario-based review tied to confidence levels. |
| Executive leadership | Portfolio resilience and stakeholder trust. | Milestone updates on state transitions, not every incident. |
Communication protocol is equally important. Internal notes should separate facts, assumptions, and open questions, with timestamps for each claim. External communication should avoid overpromising return-to-normal timelines and instead provide confidence ranges. Customers and partners generally tolerate uncertainty better than reversals. This is especially true when they are managing the same corridor risk in their own planning systems.
Post-event review should be mandatory. Teams should document which triggers fired, which did not, and where human judgment overrode the model. Over time this creates an internal evidence base for refining thresholds and reducing both false alarms and delayed responses. In fast-moving corridors, process quality is a competitive advantage.
Organizations that treat this governance layer seriously usually recover faster after corridor shocks. They preserve customer trust, control avoidable cost escalation, and enter the next cycle with clearer institutional memory instead of repeating the same reactive debates. The map becomes a management tool, not just a briefing graphic. Execution quality improves materially.
People also ask: Gulf of Aden map questions
Where is the Gulf of Aden on a map and why does it matter?
It sits between Yemen and Somalia and links Red Sea traffic to wider Indian Ocean routes, making it central to Europe-Asia trade continuity.
How do incidents in the Gulf of Aden affect shipping decisions?
They change insurer confidence, convoy behavior, and route economics, which can trigger selective or broad rerouting decisions.
Is Gulf of Aden risk only about piracy?
No. Modern risk includes piracy legacy, kinetic security incidents, and information volatility during escalation cycles.
What should teams track weekly?
Track validated incidents, insurer guidance, route adoption, and port timing variance rather than headline volume alone.
FAQ: Gulf of aden map
Where is the Gulf of Aden on a map and why does it matter?
The Gulf of Aden lies between Yemen and the Horn of Africa and connects Red Sea traffic to open-ocean trade routes, making it vital for global shipping continuity.
How do Gulf of Aden incidents affect shipping decisions?
Incidents alter insurer terms and route confidence, pushing operators to adjust convoy timing or reroute when uncertainty becomes persistent.
What indicators show Gulf of Aden risk is rising?
Recurring validated incidents, sustained premium increases, route-diversion growth, and persistent official advisories indicate rising pressure.