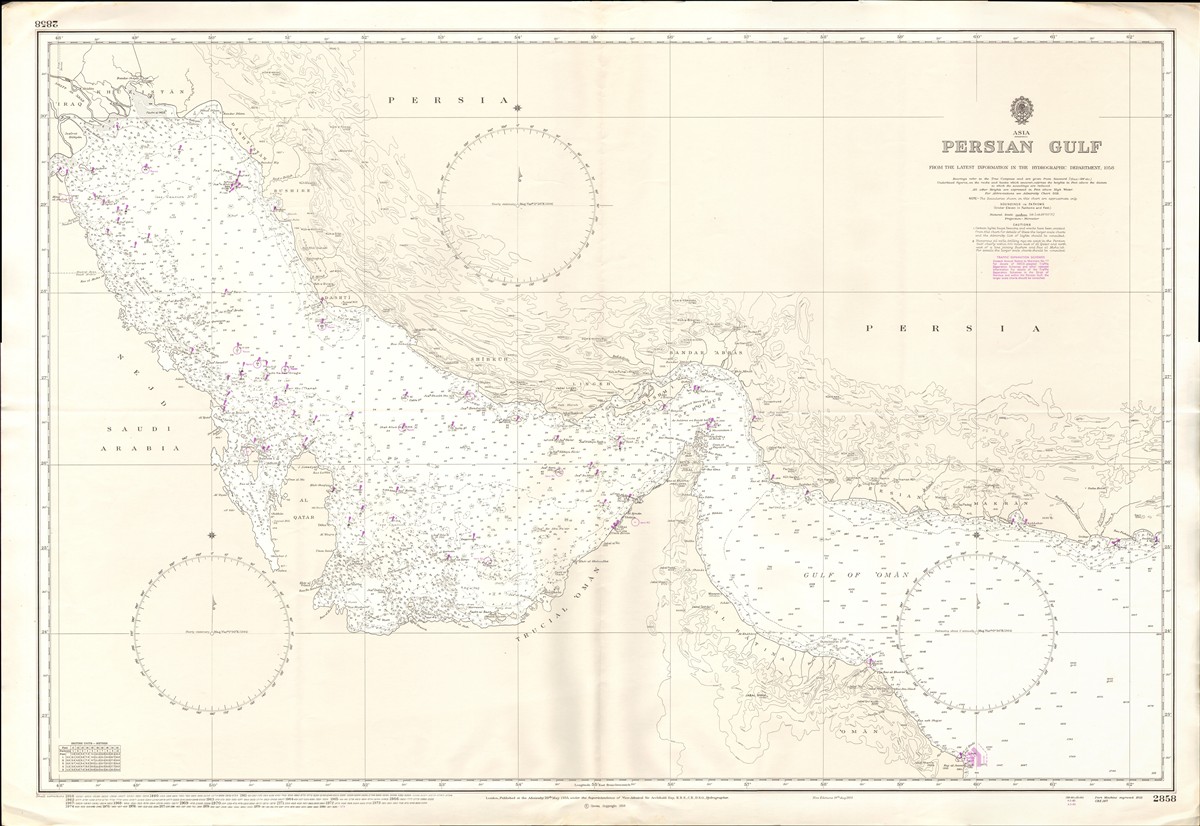
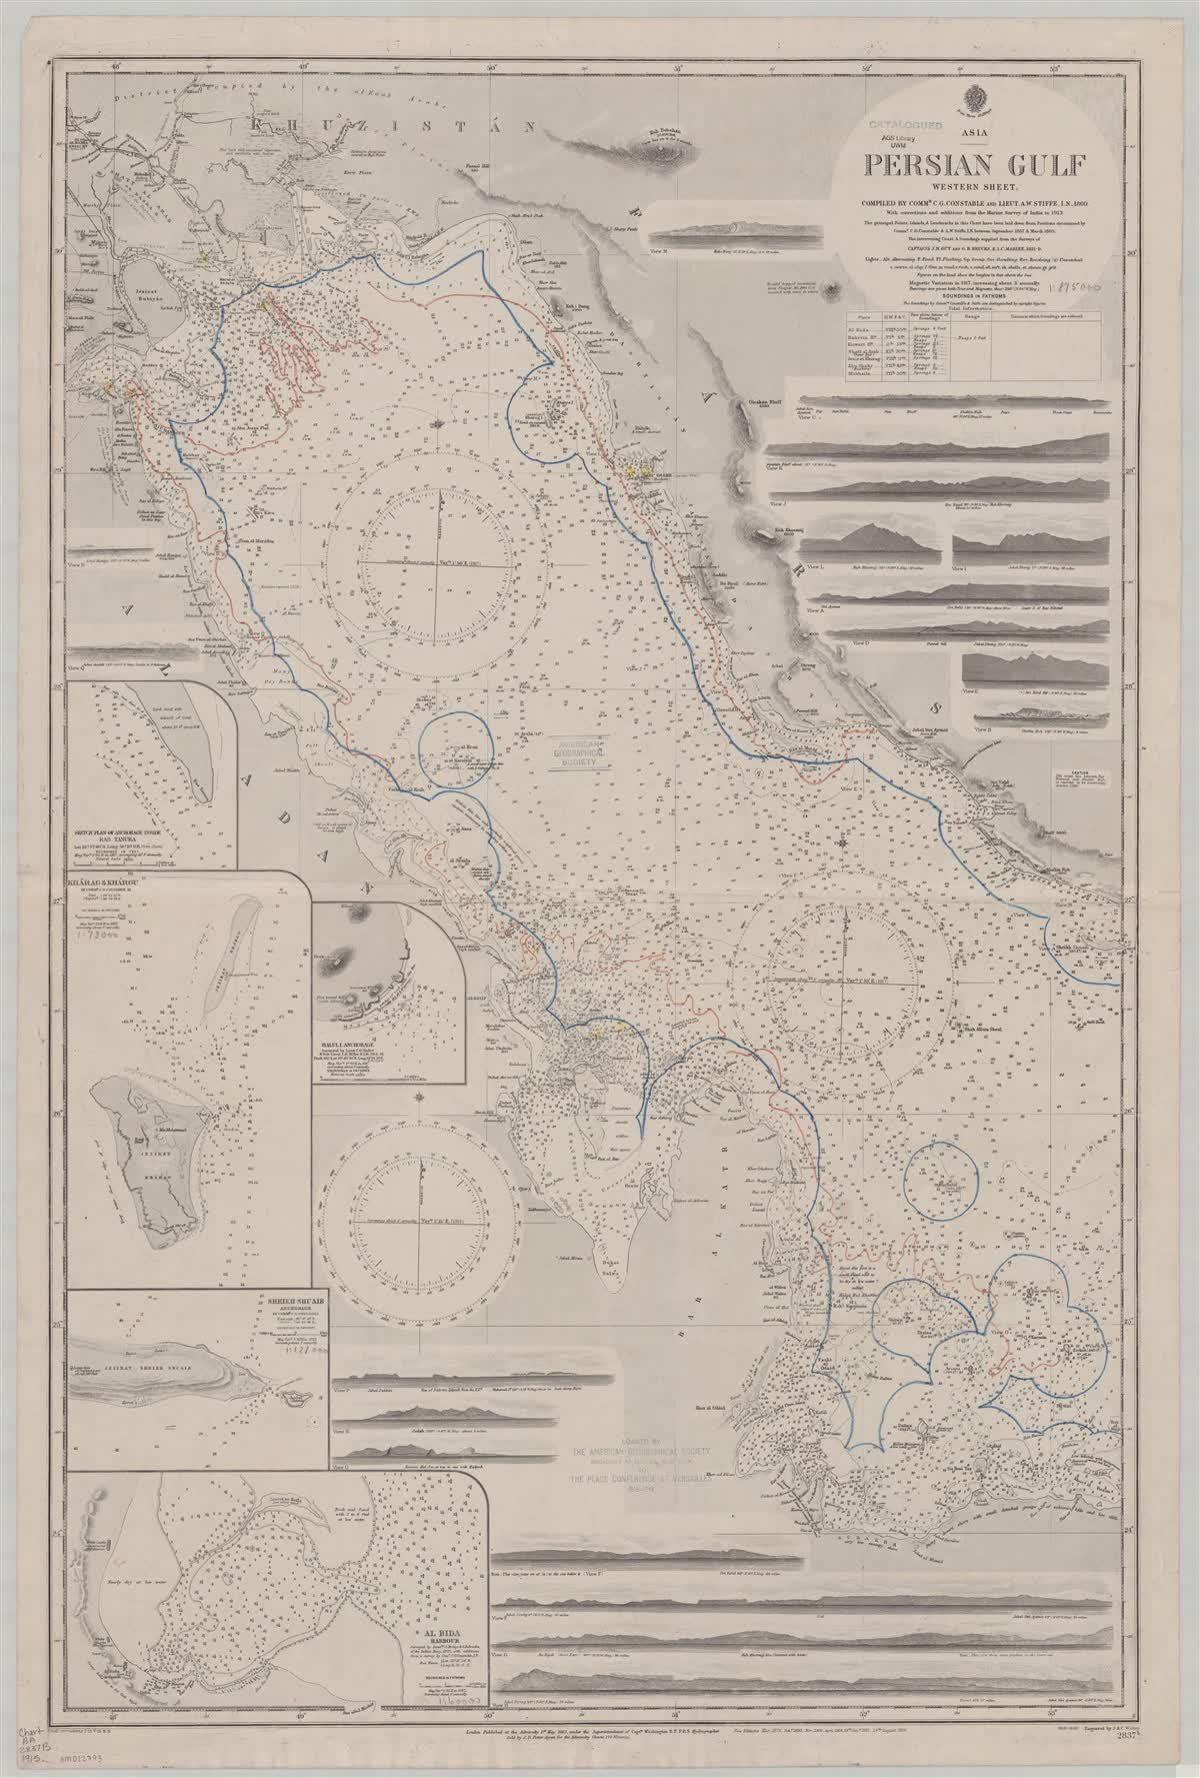
What a Persian Gulf map should include before any risk judgment
The most common analytical mistake is to treat the Persian Gulf as a uniform body of water. On a functional map, it is a segmented operating environment with variable depth, dense coast-adjacent infrastructure, and asymmetric surveillance exposure. Some lanes support stable traffic with mature logistics, while others are shaped by chokepoint logic and proximity to military assets. Analysts need this distinction before assigning probability or impact to any incident report.
A high-quality Persian gulf map should mark coastline ownership, major islands, key ports, and transition points into the Gulf of Oman and the wider Arabian Sea system. Without these layers, terms like "regional escalation" remain too vague for decision-making. Practical analysis begins when geography is connected to flows: crude export corridors, LNG routes, naval patrol arcs, and insurance sensitivity zones. That framework makes it possible to ask not only where a disruption happened, but which value chains are likely to feel it first.
This map discipline pairs directly with route-specific pages such as Strait of Hormuz on a map and Suez canal map. Taken together, these corridors define how Middle East maritime risk transmits into global freight and commodity systems.
How many countries border the Persian Gulf and why this matters
Eight countries are tied directly to the Persian Gulf system: Iran, Iraq, Kuwait, Saudi Arabia, Bahrain, Qatar, the United Arab Emirates, and Oman through its role in the Strait interface. This is not just trivia for atlases. Every coastline brings distinct port governance, maritime law practice, alliance architecture, and incident-reporting culture. Those differences complicate crisis interpretation because similar events can generate very different policy responses depending on jurisdiction.
In a stable period, this diversity can improve resilience because trade has multiple nodes. In a tense period, it can fragment coordination and create uneven security confidence across lanes. Market participants therefore watch official communications from several capitals at once, not one. A map with clear state layers helps teams identify which actors have direct operational control over nearby waters and which actors influence events indirectly through alliances and basing.
The coastline distribution also matters for domestic political risk. Leadership transitions, fiscal stress, or security incidents in one state can reshape port throughput expectations in another, especially when shipping networks are already tight. The geopolitics page on US-Iran-Israel triangle strategy adds this cross-state pressure context.
| Coastline actor | Map relevance | Operational implication |
|---|---|---|
| Iran | Northern arc and proximity to Hormuz access routes. | Security signaling influences insurer and routing behavior. |
| GCC states | Terminal concentration and major export infrastructure. | Throughput confidence drives global energy timing expectations. |
| Iraq/Kuwait | Northern production-linked maritime dependence. | Port and channel reliability are critical for export continuity. |
| Oman interface | Transition point toward Gulf of Oman and open ocean. | Key for understanding gateway resilience in stress scenarios. |
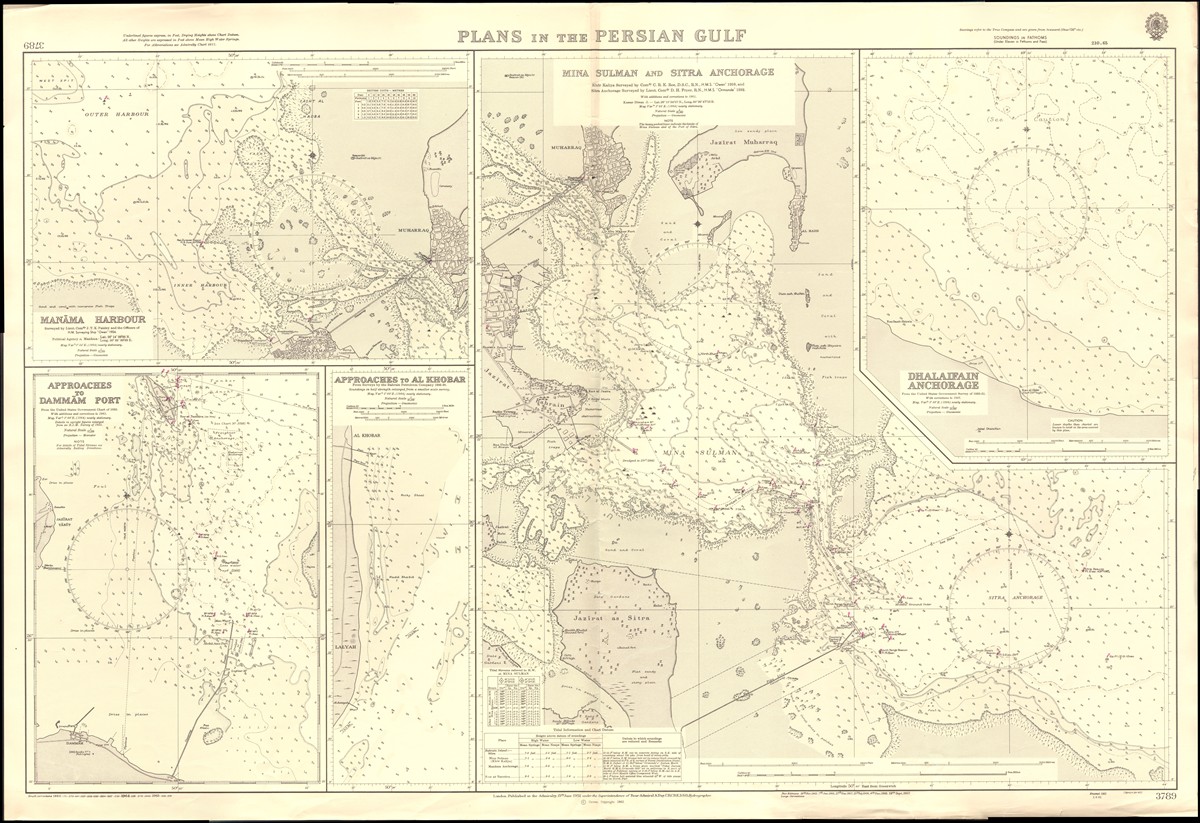
Terminal concentration: why the Persian Gulf map drives energy expectations
Energy exposure in the Gulf is not distributed evenly. Export terminals, storage nodes, and petrochemical hubs cluster in specific coastlines and islands, creating concentration risk that can be underestimated by country-level dashboards. A localized outage near a major node can have broader effects than a higher-profile event in a lower-throughput zone. That is why map-level granularity is essential for planning.
Analysts should map three layers together: physical infrastructure, shipment cadence, and redundancy options. Physical infrastructure tells you where volume originates. Cadence shows how tightly exports are scheduled. Redundancy reveals how easily throughput can shift if one node is stressed. When redundancy is weak, even moderate disruption can trigger significant freight repricing. When redundancy is strong, narrative risk may outrun actual supply effects.
For scenario modeling, combine this page with the production-focused analysis at Iran oil production and Hormuz risk. The map perspective clarifies why terminal and route concentration can transmit quickly into both physical and financial markets.
Military overlays: reading posture without overreacting to headlines
A Persian gulf map with military overlays should show basing footprints, patrol corridors, air-defense coverage, and ISR collection zones. The goal is not to predict conflict from one signal. It is to measure how many escalation buffers exist between an incident and a wider disruption. In practice, markets tend to overreact when they cannot see these buffers clearly.
Posture analysis should emphasize trend rather than isolated snapshots. Temporary deployments can look dramatic but may not change baseline deterrence geometry. Persistent changes to basing rhythm, command messaging, or corridor escort patterns are more meaningful. This is especially true when combined with changes in proxy activity or missile signaling covered in Iran weapons systems and Iran military strength.
Teams that rely on a single map layer often misread intent. Commercial actors need multi-layer interpretation: where assets are, what missions they are optimized for, and how quickly coverage can shift during a short crisis cycle. Good map practice reduces false alarms and improves resource allocation.
| Overlay layer | What it tells you | What it does not tell you |
|---|---|---|
| Bases and ports | Sustained logistics and presence capacity. | Immediate tactical intent. |
| Patrol and escort patterns | Current confidence in route security. | Long-term political alignment. |
| Air-defense footprints | Protection envelopes for key nodes. | Guaranteed interception outcomes. |
| Exercise activity | Readiness signaling and interoperability. | Inevitable near-term conflict. |
Name politics and legal framing: why terminology still affects search intent
Many users arrive through variations such as "Persian Gulf map," "Arabian Gulf map," or combined formulations. Analysts should recognize this naming dispute without allowing it to obscure operational facts. For logistics and risk work, the priority is consistent geographic reference, not terminological contest. Still, naming disputes can shape official communications and media framing, which in turn influence market psychology.
Legal interpretation adds another layer. Maritime rights and transit practices are governed by frameworks that interact with national policies, bilateral tensions, and enforcement behavior. A map with legal boundaries and transit corridors helps distinguish symbolic rhetoric from practical navigation constraints. This distinction is vital during fast-moving events when misinterpretation can drive over-hedging.
For search-intent coverage, this page keeps the focus informational and operational rather than political advocacy. The objective is to help readers answer practical questions: where routes run, where terminals cluster, and how local incidents may propagate into broader system risk.
Scenario grid: from routine operation to high-friction maritime environment
A useful scenario grid converts map observations into actionable thresholds. Instead of binary "open" versus "closed" logic, teams should classify conditions by friction level: routine, elevated, stressed, and disrupted. Each level corresponds to specific behaviors in shipping, insurance, and policy communication. This approach improves consistency across operations, finance, and executive teams.
Routine conditions feature predictable throughput and stable premium structures. Elevated conditions include localized incidents and rhetoric spikes but limited route changes. Stressed conditions show recurring advisories, selective rerouting, and wider pricing dispersion. Disrupted conditions involve multi-day uncertainty with broad contract and schedule reconfiguration. Mapping these levels against infrastructure concentration helps decision-makers prioritize what to protect first.
| Condition level | Typical indicators | Planning response |
|---|---|---|
| Routine | Stable advisories, low incident noise, normal premiums. | Baseline monitoring and periodic stress tests. |
| Elevated | Isolated incidents, sharper official rhetoric. | Increase update frequency and review exposure by corridor. |
| Stressed | Recurring warnings, selective reroutes, rising premiums. | Activate contract-flexibility playbooks and fleet alternatives. |
| Disrupted | Sustained uncertainty and broad schedule distortions. | Network-level reprioritization and executive risk governance. |
Analyst checklist for using a Persian Gulf map in weekly briefs
Every weekly brief should answer five map-grounded questions. First, where is throughput concentration shifting this week? Second, which corridors show worsening confidence indicators? Third, what changed in military posture that materially affects merchant risk? Fourth, where are legal or diplomatic communications diverging from operating reality? Fifth, what leading metrics should decision-makers watch over the next seven days? These questions prevent generic commentary and force evidence-based prioritization.
Consistency is as important as depth. Teams should keep the same base map layers over time, adding annotations for new events rather than redesigning the framework every week. This allows faster detection of abnormal patterns and reduces interpretation drift between analysts. It also improves executive trust because stakeholders can track trend continuity instead of re-learning the map at every update.
The most robust briefs cross-link map findings with adjacent thematic pages. Use Gulf of Aden map for downstream route implications, US base map for posture context, and nuclear talks analysis for diplomatic signaling that may alter maritime risk expectations.
Data quality controls: avoiding false precision in Persian Gulf map analysis
Map dashboards can create a dangerous illusion of certainty. Clean graphics do not guarantee clean inference. In the Gulf, data quality problems often come from timing mismatch, inconsistent source definitions, and selective visibility during tense periods. AIS behavior can change because of deliberate signal management, reporting delays, or commercial privacy settings. Port throughput estimates may lag real operations, while policy statements can overstate normalcy for political reasons. Analysts should therefore score each map layer by reliability before drawing conclusions.
A practical control is source triangulation by time window. If one source reports restored flow but insurer circulars remain cautious and anchorage wait times continue to rise, confidence should stay low. Conversely, if official statements, vessel movement, and freight pricing all converge, confidence can rise even when rhetoric remains heated. This method prevents analysts from over-weighting whichever source is most visible in public media. It also helps leadership understand why risk assessments can remain conservative despite optimistic headlines.
Another control is separating structural risk from event noise. Structural risk includes terminal concentration, route dependence, and limited alternatives at chokepoints. Event noise includes one-off incidents that generate attention but little sustained operational impact. A robust Persian gulf map workflow keeps both in view but does not confuse them. Over time, this improves forecasting quality, because teams stop rebuilding assumptions around every isolated event.
| Data layer | Typical weakness | Mitigation approach |
|---|---|---|
| AIS and traffic snapshots | Signal gaps and short-term anomalies. | Use rolling windows and confirm with port/agent updates. |
| Official maritime statements | Political framing can bias tone. | Cross-check with insurer guidance and vessel behavior. |
| Freight and insurance pricing | Can overreact to uncertainty spikes. | Track persistence over several sessions, not one print. |
| Media incident reporting | High visibility but uneven verification. | Require corroboration before changing base-case scenarios. |
Teams that document these controls explicitly usually produce better executive decisions under pressure. The process may look slower at first, but it reduces reversals, improves communication discipline, and protects credibility when events evolve faster than public narratives.
People also ask: Persian Gulf map questions
What countries border the Persian Gulf on a map?
Iran, Iraq, Kuwait, Saudi Arabia, Bahrain, Qatar, the UAE, and Oman in the gateway interface all shape Gulf operations through coastline or corridor influence.
Why is the Persian Gulf so important for global trade?
Because major hydrocarbon export flows and related shipping networks depend on terminals connected to this basin and its chokepoint exits.
Can small incidents in the Gulf still move markets?
Yes. If incidents occur near high-throughput nodes or during tight scheduling windows, price and freight effects can appear quickly even without total disruption.
How do analysts avoid overreacting to map headlines?
By using layered indicators and trend comparison rather than interpreting single events in isolation.
FAQ: Persian gulf map
What countries border the Persian Gulf on a map?
The Gulf system includes Iran, Iraq, Kuwait, Saudi Arabia, Bahrain, Qatar, the UAE, and the Omani gateway interface toward open-ocean lanes.
Why is a Persian Gulf map important for energy markets?
It shows where export terminals and chokepoints are concentrated, helping analysts identify where local incidents can affect global delivery timing and cost.
How should analysts read military posture on a Persian Gulf map?
Use layered interpretation of basing, patrol patterns, and infrastructure exposure rather than treating one deployment image as a full escalation signal.