Where is the Suez Canal on a map and what does the corridor control?
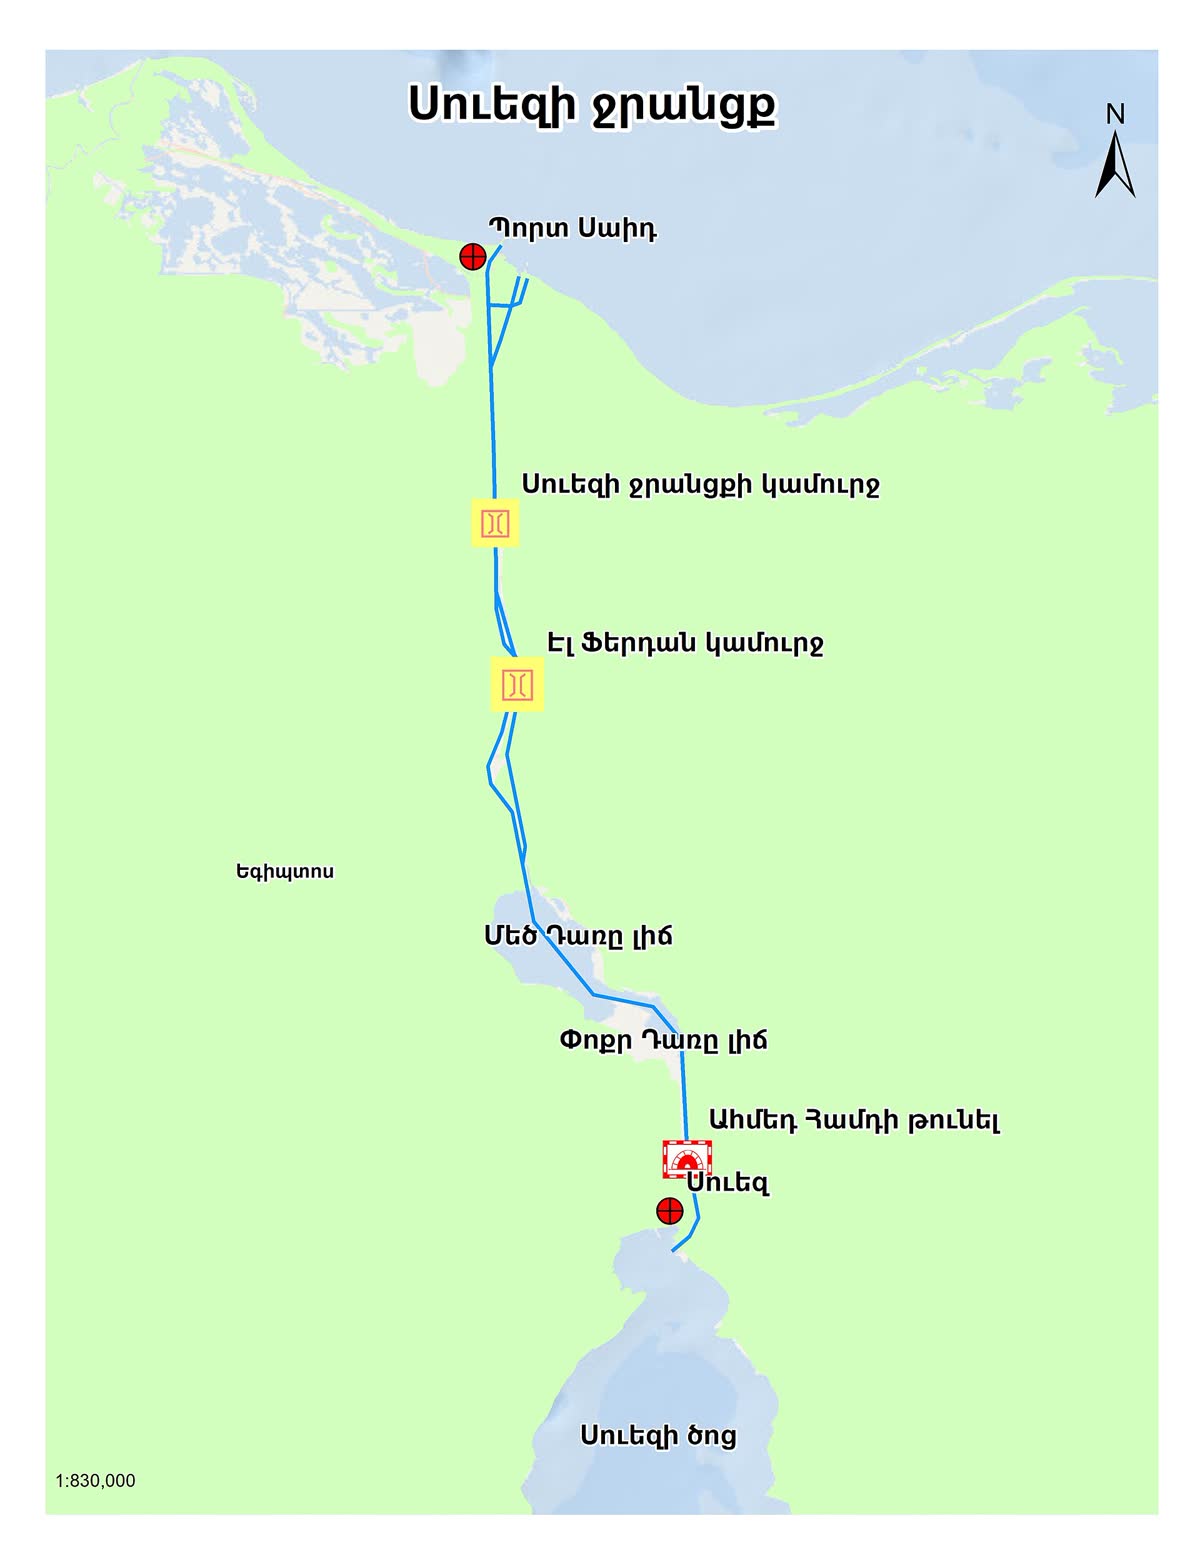
On a Suez canal map, the corridor runs north-south across Egypt, connecting Port Said on the Mediterranean side to Suez on the Red Sea side. That placement matters because it sits between production and consumption systems that move on tight commercial clocks: container supply chains, LPG cargoes, refined products, grain shipments, and military logistics. A map that only marks coastlines misses the operational point. The canal is effectively a flow regulator between two oceans with different security patterns, weather profiles, and naval postures.
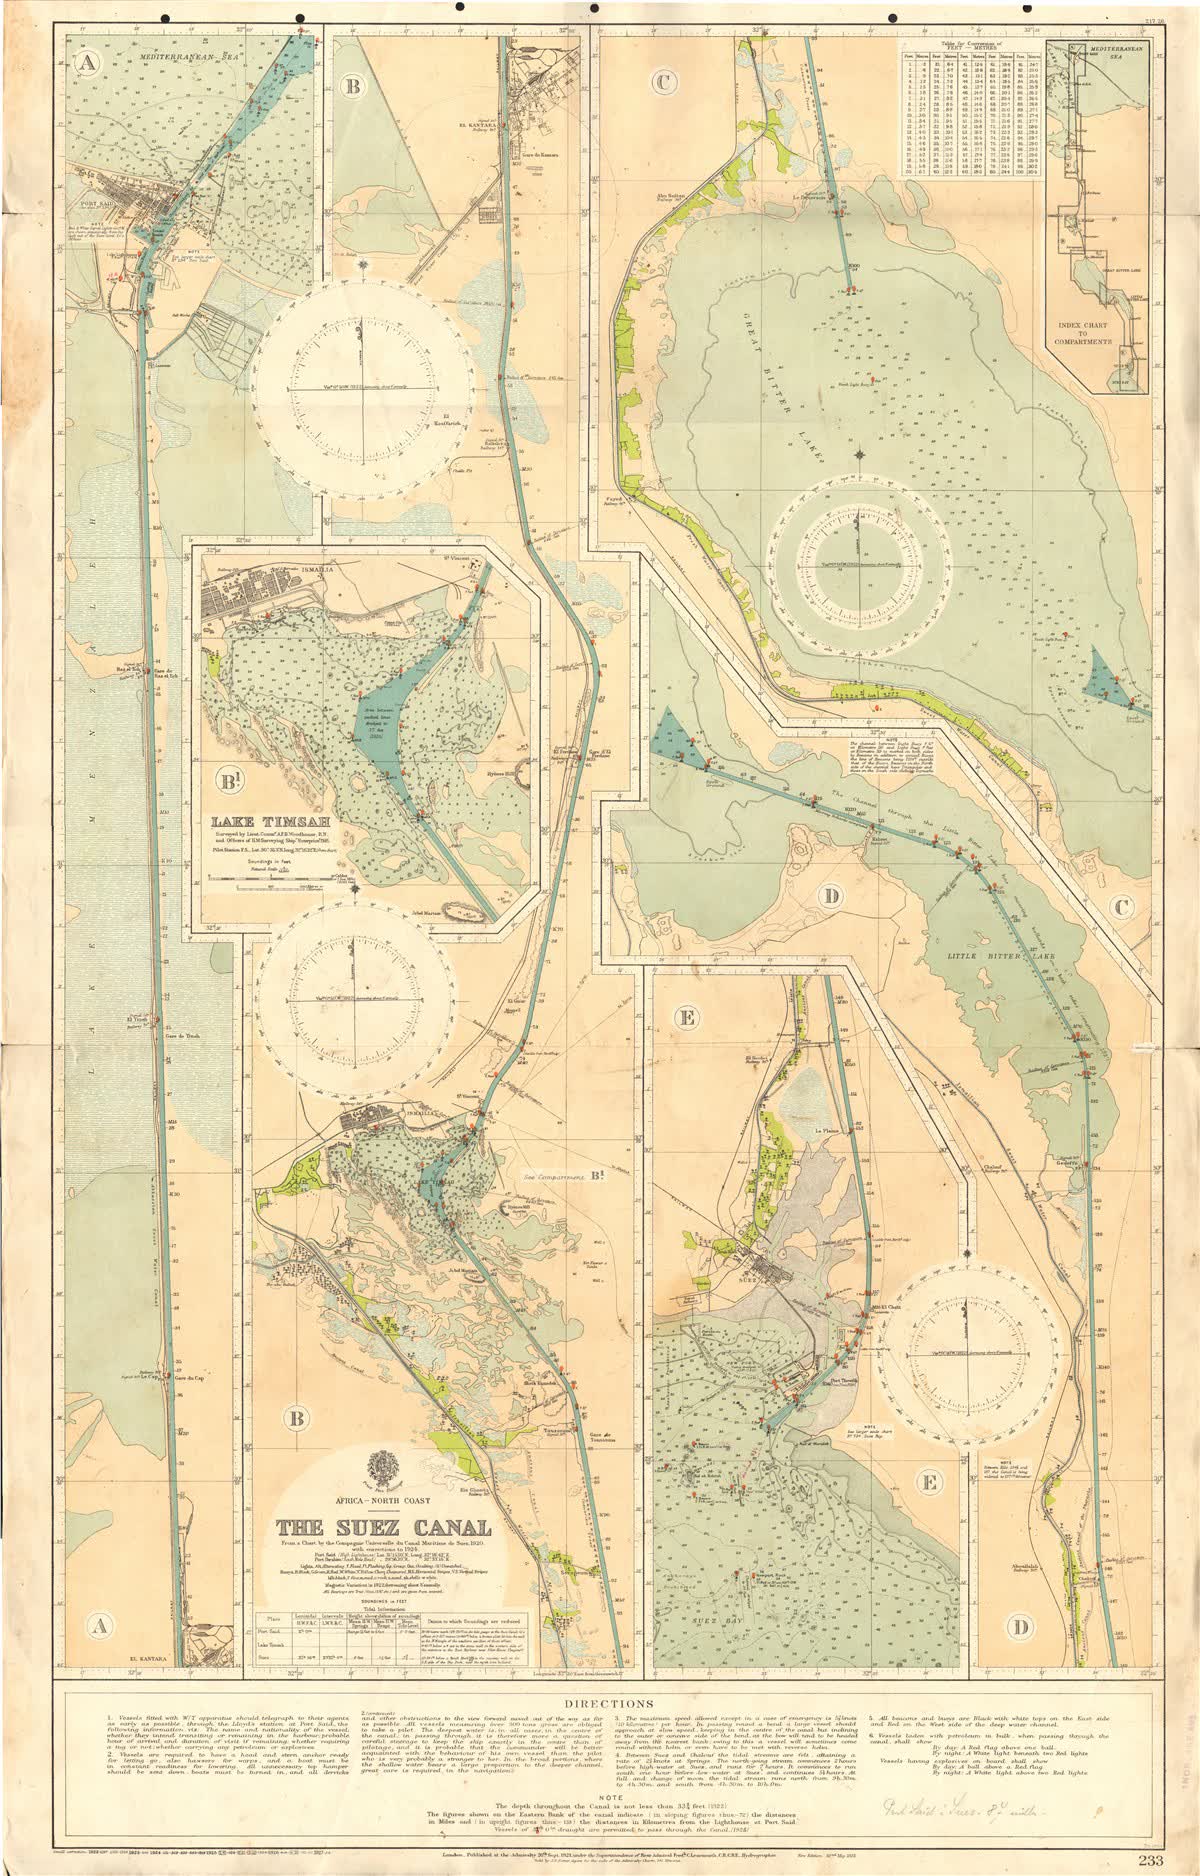
For analysts, the key map layer is not simply the waterway itself. It is the network around it: anchorage zones, convoy staging points, service ports, and alternate lanes around Africa. The relationship between those nodes determines whether an incident becomes a localized delay or a broad repricing event. This network logic is similar to how we model corridor pressure in the Strait of Hormuz map briefing, but Suez differs because queue formation and scheduling reliability are often more important than kinetic threat severity.
Another practical map element is distance elasticity. Rerouting around the Cape of Good Hope adds thousands of nautical miles, extra bunker fuel, and vessel-day opportunity cost. That means a disruption at Suez does not need to be total to hurt margins. The map itself explains why partial frictions can still drive major planning changes for charter desks and procurement teams.
How vessel traffic patterns amplify Suez canal map risk
Traffic behavior inside the canal creates nonlinear outcomes. Under routine conditions, sequencing and convoy cadence keep throughput stable. Under stress, small deviations compound. One delayed convoy can cascade into anchorage congestion, berth conflicts, and slot uncertainty at downstream ports. The map view matters here because each holding zone has finite room and response options. Congestion is spatial, not abstract.
Container, tanker, and bulk operators do not carry identical risk tolerances. Container lines often prioritize schedule integrity for network commitments, while tanker operators may tolerate selective delay if spot economics support waiting. Dry bulk routes vary by commodity urgency. When these decision models interact in constrained geography, the canal behaves like a shared clock where each actor can change everyone else's timing. That interaction explains why Suez headlines can move freight derivatives before confirmed volume losses appear in weekly data.
Readers comparing transit chokepoints should note that Suez and Hormuz transmit risk differently. Hormuz is often modeled through maritime security and export exposure, while Suez is frequently modeled through queue friction and rerouting cost. Cross-reading with oil and Hormuz risk helps separate these mechanisms instead of blending them into one generic "chokepoint" narrative.
| Traffic condition | Immediate operational effect | Market signal usually seen first |
|---|---|---|
| Normal convoy cadence | Predictable vessel windows and lower anchorage time. | Stable freight quotes and narrower risk spreads. |
| Moderate queue build | Longer waiting time and higher schedule uncertainty. | Spot charter repricing and insurer caution notes. |
| Severe corridor disruption | Rerouting decisions and fleet redeployment. | Rapid freight volatility and commodity logistics repricing. |
What incidents matter most on a Suez canal map?
Not every incident carries equal analytical weight. Mechanical blockage, collision risk, salvage complexity, and weather-visibility constraints each produce different delay signatures. A grounding in a narrow segment can block both directions immediately. A navigational advisory in a wider segment may only slow transit. Analysts should therefore pair incident type with map position before making duration estimates.
Dredging and salvage timelines are similarly map-dependent. Equipment staging speed, channel depth profile, and access constraints can reduce or extend clearing operations by days. Public reporting often highlights the event but underweights these engineering variables. If the goal is decision quality, map-aware incident taxonomy is more useful than headline volume.
Risk teams also track the informational environment. Conflicting reports during the first hours of an incident can create pricing noise. Reliable map references, official advisories, and AIS-based congestion snapshots help separate rumor from operational reality. This is the same discipline we apply in escalation monitoring on the US-Iran conflict timeline: define measurable indicators first, then interpret narratives.
When do operators reroute around Africa instead of waiting?
Rerouting is a commercial calculation, not a political statement. Operators compare expected canal delay against added distance, fuel burn, crew cost, charter obligations, and cargo delivery penalties. For high-value cargo with strict schedules, long queues can justify immediate Cape rerouting. For lower-margin cargo, waiting may still win if expected delay remains short. The decision threshold shifts with bunker prices and vessel availability.
A Suez canal map helps quantify this threshold because it anchors route alternatives in concrete distance and time. Teams typically run scenario bands: short disruption, multi-day disruption, and uncertain-duration disruption. The uncertain-duration band is often the most expensive because it freezes optionality. Fleet planners cannot fully commit to either waiting or rerouting, so both capacity and contractual exposure are stressed.
Insurance terms can tip the balance. If underwriters raise war-risk or delay-related premiums in specific legs, routes that looked cheaper on distance alone can become less attractive than expected. That is why freight analysis must integrate insurer behavior instead of assuming premiums remain static during a crisis cycle.
| Decision factor | Wait at Suez | Reroute via Cape |
|---|---|---|
| Transit time | Potentially shorter if queue clears quickly. | Longer baseline voyage but predictable once committed. |
| Fuel consumption | Lower if movement resumes on schedule. | Higher total bunker requirement from longer route. |
| Schedule reliability | Weak under uncertain queue dynamics. | Improved once fleet sequence is replanned. |
| Commercial flexibility | Better only in short-delay scenarios. | Better in prolonged or poorly signaled disruption scenarios. |
How does Suez canal map stress link to energy and inflation risk?
Energy market transmission from Suez is indirect but material. Delays in crude and refined-product routes can tighten short-term delivery windows, especially when inventories are already thin. Shipping disruptions also affect LNG and distillate timing, which can alter regional price spreads even without global supply loss. In inflation-sensitive periods, logistics volatility itself becomes macro-relevant.
The key mechanism is cost layering. Freight, insurance, and demurrage costs accumulate before consumers notice headline price changes. Import-dependent economies absorb these layers with a lag, while exporters face revenue timing uncertainty. In both directions, Suez friction functions as a tax on predictability. This is why central banks and ministries track shipping indices alongside commodity benchmarks during corridor stress.
Readers looking for integrated energy context should combine this page with Iran oil and Hormuz risk and the broader geopolitics framing in US-Iran-Israel triangle strategy. Together, these pages show how shipping chokepoints and regional security narratives can reinforce each other in pricing expectations.
Scenario framework for weekly monitoring and executive briefings
A decision-ready framework should classify Suez conditions into four operational states: normal flow, constrained flow, disrupted flow, and reroute-dominant flow. Each state should be tied to observable metrics rather than broad sentiment. That lets teams make timing decisions with shared thresholds and avoid reactive policy swings based on social-media noise.
For each state, define trigger thresholds and playbooks. In constrained flow, operators may hold near-term commitments while increasing slot flexibility. In disrupted flow, they may pivot selective cargoes to alternate routes and renegotiate delivery windows. In reroute-dominant flow, they prioritize network integrity and contract risk management over single-voyage efficiency. Structured playbooks reduce internal friction during fast-moving events.
Analyst teams should also document confidence levels. A high-confidence short disruption calls for different action than a low-confidence forecast with conflicting official updates. Decision logs are valuable after the event because they improve future threshold tuning and governance reviews.
| State | Primary indicators | Recommended action focus |
|---|---|---|
| Normal flow | Stable queue, regular advisories, low premium shifts. | Routine monitoring and baseline contingency readiness. |
| Constrained flow | Queue expansion, delayed convoy cadence, insurer watch notices. | Flexible scheduling and contract exposure review. |
| Disrupted flow | Confirmed blockage or severe slowdown with uncertain duration. | Selective rerouting and high-frequency stakeholder updates. |
| Reroute-dominant flow | Persistent clearing uncertainty and widening rate volatility. | Fleet-network reprioritization and risk-budget activation. |
Operator playbook: what to do in the first 24, 72, and 120 hours
Most costly decisions during a Suez event are made too early or too late. In the first 24 hours, the objective should be information quality, not dramatic route shifts. Teams should build a single operating picture from official notices, AIS congestion, port-agent updates, and insurer bulletins. This short window is where confusion is highest, especially when unofficial accounts overstate clearance progress. A disciplined first-day workflow prevents unnecessary rerouting and protects commercial credibility with cargo customers.
By the 72-hour mark, uncertainty usually narrows enough for differentiated action. Operators can segment voyages by cargo sensitivity and schedule rigidity rather than applying a single fleet-wide response. Time-critical container moves may justify reroute commitments, while lower-urgency bulk cargo can remain in wait posture with contract renegotiation pathways prepared. Finance and legal teams should be involved at this stage, because demurrage, laytime, and force-majeure interpretation quickly become material. The best-performing organizations treat this as a cross-functional problem, not just a marine-operations issue.
At 120 hours, the question shifts from tactical response to network recovery. Even if canal movement resumes, backlog clearing can keep schedules unstable for days. Recovery planning should include berth reprioritization, slot swaps, and customer communication cadences tied to confidence intervals, not optimistic guesses. This is where executive governance matters: deciding which contracts to protect first, where to absorb margin pressure, and how to rebalance risk across routes. A strong recovery plan often determines whether disruption becomes a quarterly setback or a durable customer-retention problem.
| Decision window | Priority actions | Common failure mode |
|---|---|---|
| 0-24 hours | Establish verified incident picture, assign single decision owner, freeze non-essential rerouting. | Reacting to unverified reports and locking in high-cost route changes. |
| 24-72 hours | Segment cargo by urgency, engage insurers and legal teams, update customer ETAs with confidence bands. | Using one uniform action for all vessel classes and cargo contracts. |
| 72-120 hours | Commit selective reroutes, renegotiate delivery windows, prepare backlog-recovery sequencing. | Assuming reopening equals immediate normalization of throughput. |
| 120+ hours | Execute recovery governance, measure variance from plan, capture lessons for threshold tuning. | Ending incident process too early and missing post-event schedule drag. |
People also ask: practical Suez canal map questions
Where is the Suez Canal on a world map?
It crosses Egypt from Port Said to Suez, connecting Mediterranean shipping lanes to the Red Sea and onward to the Indian Ocean system. Its position removes the need for many Europe-Asia voyages to round southern Africa.
How long does a full Suez transit take under normal conditions?
Transit time varies by traffic, vessel class, and convoy scheduling, but the critical variable for operators is total passage plus waiting time at staging areas. Queue behavior can dominate voyage planning more than pure transit speed.
What happens to freight rates when Suez delays grow?
Rates usually rise first in spot segments where capacity is tight and schedule reliability matters. Insurance and demurrage expectations then reinforce pricing changes if uncertainty persists.
Is Suez risk only a shipping issue?
No. Shipping disruptions can influence energy timing, inventory confidence, and inflation-sensitive procurement costs. That is why macro desks and policy institutions monitor this corridor closely.
FAQ: Suez canal map
Where is the Suez Canal on a map and why is it strategic?
The canal lies in Egypt between the Mediterranean and Red Sea. Its strategic value is the route-time reduction it provides for intercontinental trade and energy flows.
How does Suez disruption affect freight and energy markets?
Disruption pushes up delay risk, insurance premiums, and rerouting costs, which can quickly propagate into freight markets and commodity logistics pricing.
What indicators should analysts track for Suez risk?
Track queue length, convoy intervals, insurer guidance, salvage progress, and rerouting share toward the Cape corridor.