Where is Bab el-Mandeb on a map, and what does it connect?
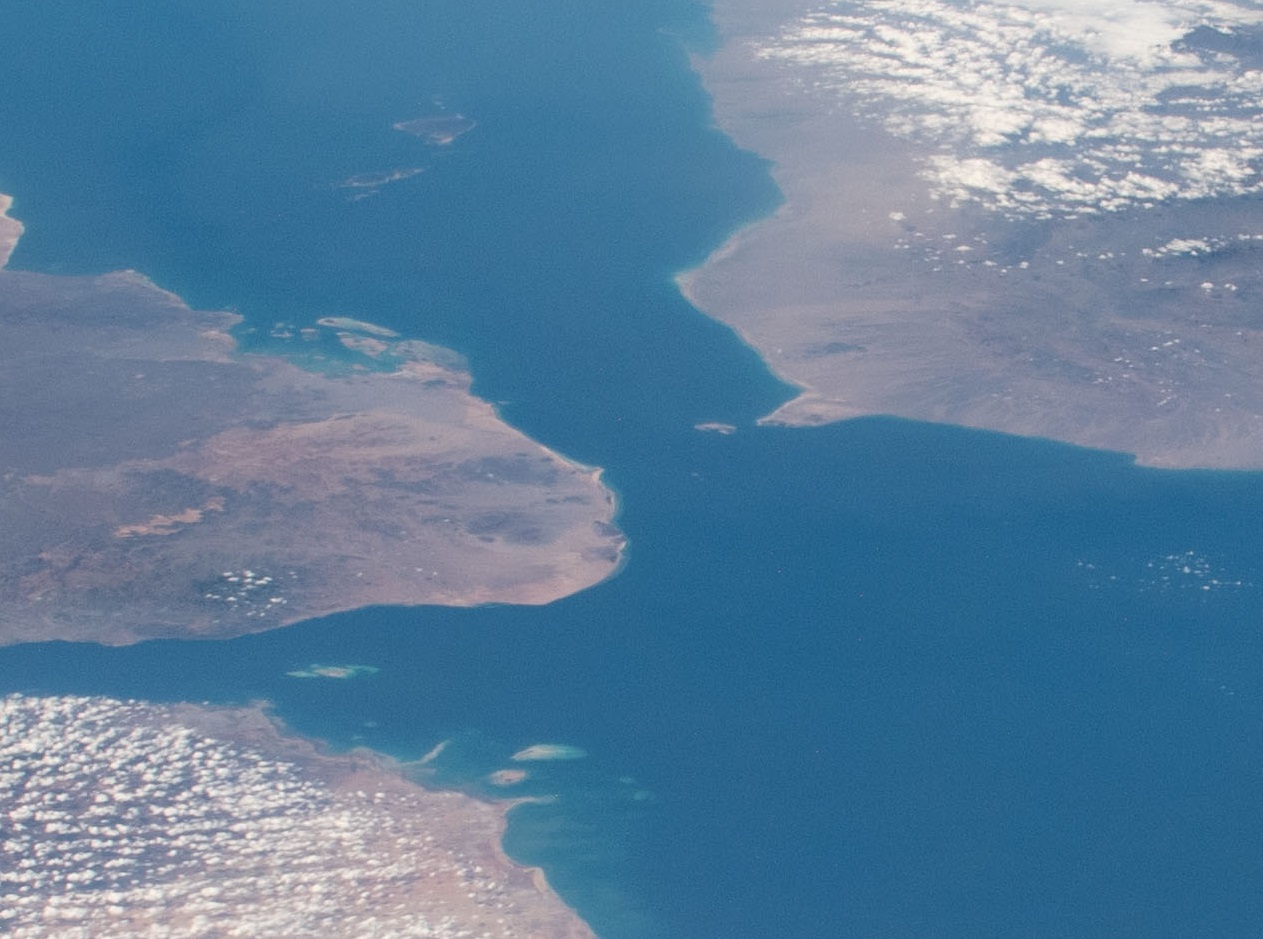
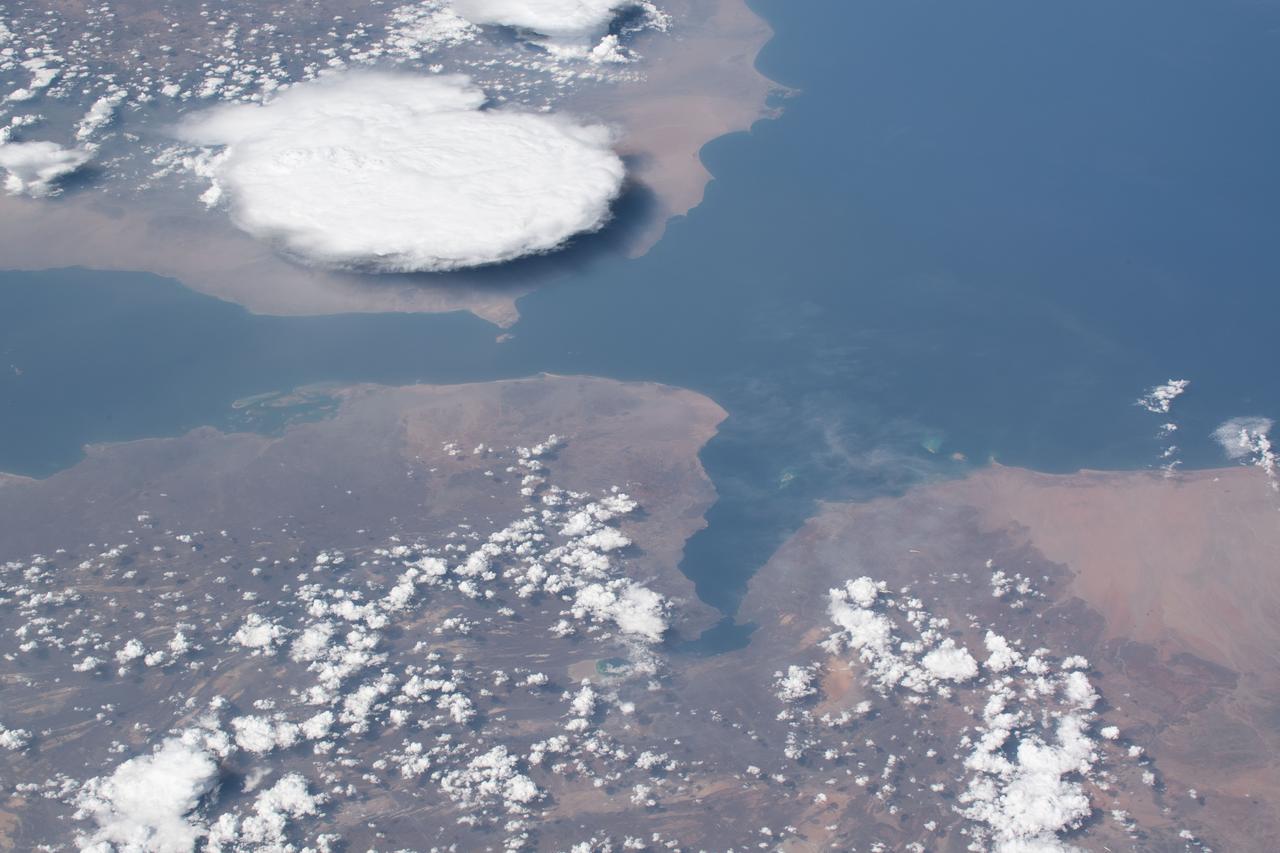
On a regional chart, Bab el-Mandeb sits between Yemen on the Arabian side and Djibouti and Eritrea on the African side, connecting the Red Sea to the Gulf of Aden. That placement makes it the direct southern approach to Suez-linked traffic. If you trace eastbound or westbound container and tanker movement between Asia and Europe, this passage repeatedly appears as a structural checkpoint rather than a discretionary shortcut.
Geography alone explains only half the story. The other half is network dependency. A closure or severe risk spike at this point does not just affect local shipping. It cascades into Suez scheduling, Mediterranean arrivals, and the workload on the Cape of Good Hope fallback route. This is why most high-quality Suez Canal map and Gulf of Aden map workflows now treat the three spaces as one linked operating system.
Britannica's baseline reference describes Bab el-Mandeb as a strait about 20 miles wide, split by Perim Island into a broader western channel and a narrower eastern passage. That channel split matters for traffic concentration and risk analysis because constrained routing increases the impact of both accidental and intentional disruption.
| Map layer | What to verify first | Why it changes risk interpretation |
|---|---|---|
| Coastline geometry | Djibouti, Eritrea, Yemen boundaries and channel separation | Defines baseline navigational constraint and exposure corridors. |
| Route network | Linkages to Red Sea, Suez, and Gulf of Aden lanes | Shows whether disruption remains local or propagates globally. |
| Security context | Recent incidents, patrol patterns, and advisories | Translates static map data into operational risk posture. |
Why is Bab el-Mandeb important for global trade and energy?
Bab el-Mandeb matters because it carries both containerized trade and energy flows that underpin Europe-Asia commerce. The U.S. EIA's chokepoint assessment reports Bab el-Mandeb oil transit at 9.3 million barrels per day in 2023, falling to 4.1 million barrels per day in 2024 and 4.2 million barrels per day in the first half of 2025 as conflict-era route choices changed. Those figures are not just energy trivia. They are evidence of how quickly route stress can rewire global movement patterns.
For non-energy readers, the practical translation is simple: when this corridor is stable, schedules through Suez are easier to maintain; when risk rises, route reliability degrades and logistics costs climb. UNCTAD's maritime reporting captures the same mechanism from a trade perspective, showing steep declines in Suez and Gulf of Aden activity during high-risk periods and corresponding increases in Cape routing.
This chokepoint therefore behaves like a pressure valve. It can absorb routine volatility, but sustained insecurity pushes carriers toward longer alternatives. That creates a cost ladder: more nautical miles, higher fuel burn, tighter vessel availability, and slower inventory cycles for importers.
How wide is the Bab el-Mandeb Strait, and why channel geometry drives risk
Open-source references generally place the strait around 20 miles across at its broad frame, with practical shipping movement narrowed by channel structure around Perim Island. Even in calm conditions, this geometry imposes path dependence. In tense conditions, it magnifies risk concentration because traffic has fewer practical choices for safe and efficient transit.
That geometry affects three operational dimensions. First, convoying and traffic coordination become more consequential because lane discipline reduces incident probability. Second, the insurance market reacts quickly because underwriters know constrained spaces reduce tactical flexibility. Third, naval and coast-guard signaling has amplified effect because patrol placement in narrow approaches can alter perceived corridor safety.
A robust bab al mandab map workflow should therefore include both physical and behavioral layers. Physical layers cover width, island separation, and major approach lanes. Behavioral layers include recent vessel speed changes, waiting patterns near approaches, and reroute frequency toward southern Africa. Combined, they offer a much cleaner read than static map labels alone.
| Geometry factor | Operational consequence | Planning implication |
|---|---|---|
| Channel split around Perim | Traffic funneling into constrained tracks | Higher value from disciplined routing windows and escorts. |
| Narrow approach sectors | Lower maneuver margin under stress | Faster shift from routine transit to contingency posture. |
| Long linked corridor to Suez | Delay propagation across multiple nodes | Need integrated Red Sea plus Mediterranean ETA planning. |
How does Bab el-Mandeb disruption change Suez and Cape routing decisions?
Most operators compare two imperfect options when risk rises: continue through Red Sea and Suez with security premiums, or reroute around the Cape of Good Hope with longer distance and time. UNCTAD's 2024 maritime review quantifies this tradeoff clearly, noting that a Shenzhen-to-Rotterdam trip can move from roughly 10,000 nautical miles via Suez to around 13,000 nautical miles via the Cape, with voyage duration rising from about 31 days to roughly 41 days in representative conditions.
That ten-day spread is strategically significant. It ties up ship capacity, disrupts terminal planning, and shifts container availability in downstream markets. In practice, carriers do not switch instantly as a block. They phase decisions based on threat trajectory, charter economics, and customer commitments. That is why the same week can show mixed behavior: some lines holding Red Sea transits, others preemptively diverting.
For importers and commodity buyers, the map lesson is to track corridor coupling rather than isolated headlines. A Bab el-Mandeb shock should be read alongside Strait of Hormuz route risk and oil market transmission channels, because compound chokepoint stress raises system-wide volatility faster than single-node disruption.
Security layer: what incidents matter most on a red sea shipping route map?
Not every incident has equal forecasting value. High-signal events are those that materially change operator behavior: repeated attacks on commercial lanes, insurer advisories that alter war-risk pricing, and carrier notices that suspend or restart corridor use. Lower-signal events are single-source rumors without corresponding movement in ship traffic or insurance commentary.
A practical monitoring stack combines three inputs. First, maritime advisories and incident logs. Second, route-behavior data such as transit counts and diversions. Third, market signals, including freight index moves and charter sentiment. IMF PortWatch commentary has emphasized this coupling, showing how chokepoint stress appears in trade flow patterns before it fully appears in conventional monthly trade statistics.
The implication for analysts is discipline in evidence weighting. If rhetoric escalates but transits remain stable and premiums hold, the market is treating the event as contained. If premiums jump and diversions accelerate, the system is repricing corridor reliability, and risk assumptions should be updated immediately.
Scenario framework for a bab el mandeb chokepoint briefing
Scenario A: Controlled risk, corridor open
In this state, occasional incidents occur but security conditions remain manageable enough for regular passage. Transit volatility exists, yet aggregate route choice remains mixed rather than one-directional. Freight costs stay elevated versus calm baselines but avoid extreme spikes.
Scenario B: Partial disruption, selective diversion
In this state, risk is high enough that many carriers divert around Africa while some continue Red Sea transits under tighter risk controls. Schedule reliability deteriorates, inventory buffers shrink, and charter markets tighten because round-trip cycles extend.
Scenario C: Sustained disruption, widespread rerouting
In this state, most commercial operators avoid the corridor for prolonged periods. Cape route dependency rises, global vessel demand increases in ton-mile terms, and delivery windows stretch across multiple supply chains. Insurance and security cost pass-through becomes broad-based.
| Scenario | Transit behavior | Likely cost effect | Best analyst action |
|---|---|---|---|
| Controlled risk | Mixed routing, corridor largely open | Moderate premium persistence | Track weekly incident-to-transit ratio. |
| Partial disruption | Selective diversion to Cape | Freight and schedule stress | Rebase ETA assumptions and inventory buffers. |
| Sustained disruption | Broad Cape rerouting | High transport and finance costs | Shift planning to long-duration contingency mode. |
Operator playbook: how to use a Bab el-Mandeb map in weekly planning
A strong weekly process starts with a fixed checklist rather than ad hoc reading. First, confirm corridor status from multiple reputable channels. Second, compare current route behavior against the prior four-week baseline. Third, map expected effect on delivery windows by lane and cargo sensitivity. Finally, publish decisions with explicit confidence levels so downstream teams can plan around uncertainty bands.
For shipper and importer teams, map-driven planning should include both tactical and strategic horizons. Tactical means 7- to 14-day decisions about rerouting and buffer stock. Strategic means 30- to 90-day decisions about contract terms, freight budgeting, and supplier sequencing. Without this split, organizations either overreact to short spikes or underreact to persistent stress.
This is also where internal linking across this site helps. Use the U.S. basing map for force-posture context, the Gulf of Aden map for route-incident interpretation, and the triangle strategy briefing for escalation logic that can quickly alter maritime assumptions.
People also ask: Bab el-Mandeb map questions
Where is Bab el-Mandeb on a map?
It lies between Yemen and the Horn of Africa, linking the Red Sea and Gulf of Aden. In practical shipping terms, it is the southern gate to the Suez corridor.
Why is Bab el-Mandeb important for global trade?
It concentrates Europe-Asia maritime traffic and key energy flows into a constrained passage. Disruption there can trigger longer routes, higher costs, and slower delivery cycles.
How wide is the Bab el-Mandeb Strait?
Reference sources often cite about 20 miles across in broad terms, with narrower operative channels around Perim Island. Those narrower tracks matter most for risk and traffic management.
What happens if Bab el-Mandeb closes?
Carriers shift toward Cape of Good Hope routing when risk thresholds are breached. The tradeoff is higher fuel burn, longer transit time, and tighter vessel availability in global schedules.
FAQ: bab el mandeb strait map
Is Bab el-Mandeb the same as the Gulf of Aden?
No. Bab el-Mandeb is the narrow connecting strait, while the Gulf of Aden is the larger basin to the southeast. They operate as a linked corridor but are different geographic units.
Does every disruption force immediate Cape rerouting?
Not always. Operators usually assess threat persistence, insurance terms, and customer commitments before diverting. Short incidents may produce caution without full reroute behavior.
Why do analysts pair Bab el-Mandeb and Suez in one model?
Because throughput and timing effects propagate across both nodes. A disruption at one point changes scheduling and cost outcomes along the full route chain.
What is the most useful weekly indicator?
A combined view of incident severity, transit counts, and diversion rates is usually strongest. Any single metric can mislead when used in isolation.